EV Charging Curves Explained: When Fast Charging Slows
The EV charging curve explains how battery temperature and charge level affect power, helping you plan realistic road-trip charging stops.
As an Amazon Associate, EV Charging may earn from qualifying purchases. This helps support our independent guides at no extra cost to you. Learn more.
Fast charging slows when the battery's control system reduces incoming power, usually as the battery fills or its temperature limits what it can accept. An EV charging curve shows that changing power across a charging session, which explains why a big number on the charger doesn't promise a short stop.
The number that matters most is sustained charging power over the battery range you actually use. That brief peak? Lovely to see. It still has to do some work.
Start with what the curve measures, and the slowdown becomes much easier to understand.
This post may contain affiliate links. If you make a purchase through these links, I may earn a small commission at no extra cost to you.
Key Takeaways
- Charging power changes during a session. State of charge, battery temperature, vehicle limits, and available station output all influence it.
- Tapering often becomes more noticeable near a high state of charge, but reductions can begin well before 80%.
- Preconditioning helps a battery reach its available charging performance sooner. It doesn't remove the normal slowdown as the battery fills.
- Use the next driving leg and a sensible arrival reserve to choose your departure charge. An 80% target is useful for planning, but it isn't a reason to leave without enough energy.
What an EV Charging Curve Shows
A charging curve describes how quickly an EV accepts energy at different points in its battery's charge range. Most DC fast-charging charts put state of charge along the bottom and charging power up the side.
Power, Energy, and Battery Percentage
Charging power is measured in kilowatts, or kW. Energy is measured in kilowatt-hours, or kWh. State of charge, usually shortened to SOC, is the battery percentage on your dashboard.
Those units describe different things. Power tells you the rate of energy transfer right now. Energy tells you how much has been delivered over time.
A percentage alone doesn't tell you how many kilowatt-hours a vehicle needs. That also depends on usable battery capacity. The same percentage increase can mean substantially different amounts of energy in different vehicles.
Our guide to charging power and energy units explains how volts, amps, kW, and kWh fit together.
Reading the Shape of the Line
A rising line means charging power is increasing. A flat section means power is holding fairly steady. A falling line shows reduced power, often called tapering.
Some vehicles have a broad plateau. Others reach a pronounced peak and then step down. A session can also begin slowly, rise as the battery warms, and taper later.
The Department of Energy's road-trip charging infrastructure report uses charging curves to describe power as a function of battery SOC.
Pay attention to the axes before comparing charts. A curve drawn against elapsed time tells a different part of the story than one drawn against battery percentage.
Why Fast Charging Slows as the Battery Fills
Inside the battery, charging involves moving lithium ions into electrode materials. That process has electrical, chemical, and thermal limits. The battery management system, or BMS, controls charging within those limits.
Rising Voltage Eventually Requires Less Current
During charging, cell voltage generally rises. As cells approach their allowed upper voltage, the charging system reduces current to keep them within their operating limits.
Since electrical power depends on voltage multiplied by current, a substantial current reduction lowers charging power. You see that reduction on the station display as fewer kilowatts.
The familiar constant-current/constant-voltage charging model helps explain this behavior. Current can remain relatively steady during part of charging, then decline as voltage is held near its upper limit.
An actual EV session can look messier. Manufacturers use temperature-dependent limits, staged current reductions, and other controls. So a real trace may resemble stairs more than a smooth slide.
The Pack Has to Respect Individual Cells
An EV battery contains many cells connected in groups. They don't all behave identically. Small differences in temperature, resistance, and state of charge affect how the pack accepts power.
The BMS monitors cell-group voltages and temperatures. A group nearing its limit can constrain the whole pack, even when the dashboard still shows room remaining.
Cell balancing can also become relevant near the upper end. The system manages differences between cell groups rather than simply pushing every group harder.

The 2030 National Charging Network report describes how the BMS tapers charging as SOC increases to protect the pack.
That slowdown is part of the charging strategy. A charger with more capacity can't override it. The vehicle requests an acceptable charging level, and the station supplies power within that request and its own capabilities.
When Does the Slowdown Start?
There's no single percentage where every EV suddenly changes pace. The curve depends on the battery design, temperature, software, and charging equipment.
Still, the upper portion of the battery usually demands more patience. That part of the reputation is earned.
Taper Can Begin Before 80%
The common advice to stop around 80% can create an odd expectation: full speed until 79%, then the brakes.
Many vehicles reduce power earlier. A peak may occur at a relatively low SOC, followed by several reductions before the battery reaches 80%. Another vehicle may hold a lower but steadier rate across more of the session.
This is why arriving at 55% and expecting the advertised maximum can lead to disappointment. The battery may already be beyond the portion where that maximum is available.
Very low SOC also doesn't guarantee instant peak power. Initial ramp-up, battery temperature, and vehicle controls still matter.
The Last Portion Often Takes Disproportionately Longer
Near full charge, reduced current means each additional percentage point can take longer. The final portion can feel stubborn because the rate has changed while your expectation hasn't.
Charging between 90% and 100% shouldn't be timed using the pace you saw around the middle of the battery. The amount of percentage gained may look similar; the permitted power can be very different.
Our explanation of 80% and 100% charging limits separates a road-trip charging target from an everyday home-charging routine.
An 80% departure target is a time-management choice. Your next driving leg still gets a vote.
Extra energy can justify the wait when the next compatible charger is far away.
Peak Charging Power vs. Average Charging Power
Peak power gets attention because it's easy to print in large type. Average power is less glamorous, but it has a much closer relationship with how long you stand beside the car.
A Broad Plateau Can Beat a Brief Peak
Two vehicles can have similar advertised maximum charging power and quite different stop times. One might hold strong power across much of its useful charging window. Another might touch its maximum briefly, then reduce it.
Compare the whole relevant stretch of the curve, not just its tallest point.
Battery size matters too. A larger pack needs more energy for the same percentage increase. A fast percentage climb and a high energy-transfer rate aren't automatically the same achievement.
And road-trip usefulness adds another layer: vehicle efficiency. A more efficient EV can gain more driving distance from the same energy delivered.
That makes maximum kW an incomplete shortcut for both charging time and miles added.
Calculate an Average Using Matching Measurements
Average charging power equals energy delivered divided by elapsed charging time, with time expressed in hours.
For example, 100 kW maintained for six minutes transfers 10 kWh. That's a unit relationship, not a prediction that a particular EV will hold 100 kW.
Measurement boundaries matter. Energy measured at the charger can include energy that doesn't remain stored in the battery. Battery heating, cooling, conversion losses, and other loads create differences.
A session average based on charger-metered energy should therefore be described as charger-side average power. It isn't automatically the battery's net energy-storage rate.
Also distinguish active charging time from the full stop. Finding a stall, starting payment, connecting, and disconnecting all affect your journey. A good battery curve can't erase a ten-minute queue.
What 10% to 80% Charging Times Tell You
A 10% to 80% charging time is useful because it describes a defined window. It covers 70 percentage points while avoiding much of the slowest final stretch.
Useful, yes. Complete, no.
The Conditions Belong With the Claim
A published charging time depends on the test setup. Starting battery temperature, station capability, software, and battery configuration can all change the result.
Even the starting percentage deserves attention. A session beginning at 10% isn't directly comparable with one beginning at 30%, especially when the vehicle's strongest charging performance occurs early.
The station must also provide the voltage and current the vehicle needs. A large maximum power rating doesn't describe its full operating range.
When comparing published results, favor tests that identify these conditions. A charging time without them leaves too much room for assumptions.
Porsche's charging guidance, for example, ties its best stated performance to battery preconditioning and a suitably capable DC station. Those conditions are part of the performance claim.
The Result Doesn't Scale Linearly
A 10% to 80% time doesn't tell you how long 0% to 100% will take through simple multiplication. The power changes across the charge range.
The lower end can include a different ramp-up behavior. The upper end brings more taper. Both sections sit outside the advertised window.
The same caution applies when estimating a partial stop. Half the percentage increase doesn't necessarily mean half the time.
For travel planning, use a prediction for your actual arrival and departure percentages when one is available. Vehicle routing systems can account for more of the charging behavior than a calculation based only on peak kW.
The useful question is how long your required energy takes, under the conditions you expect.
How Battery Temperature Changes the Curve
A battery can reach a charger at a low percentage and still accept modest power. Temperature is one reason. The cells need suitable conditions before high-current charging makes sense.
A Cold Battery May Start Slowly, Then Improve
Cold conditions slow the movement of lithium ions and increase resistance. High charging current under unsuitable conditions also raises the risk of lithium plating, where metallic lithium deposits on the anode.
The BMS limits current to reduce that risk. As the pack warms, the vehicle may allow more charging power. That produces a curve that climbs after connection rather than starting near its highest level.
Ambient temperature and battery temperature aren't interchangeable. A car parked overnight in freezing weather can behave differently from one arriving after sustained highway driving.
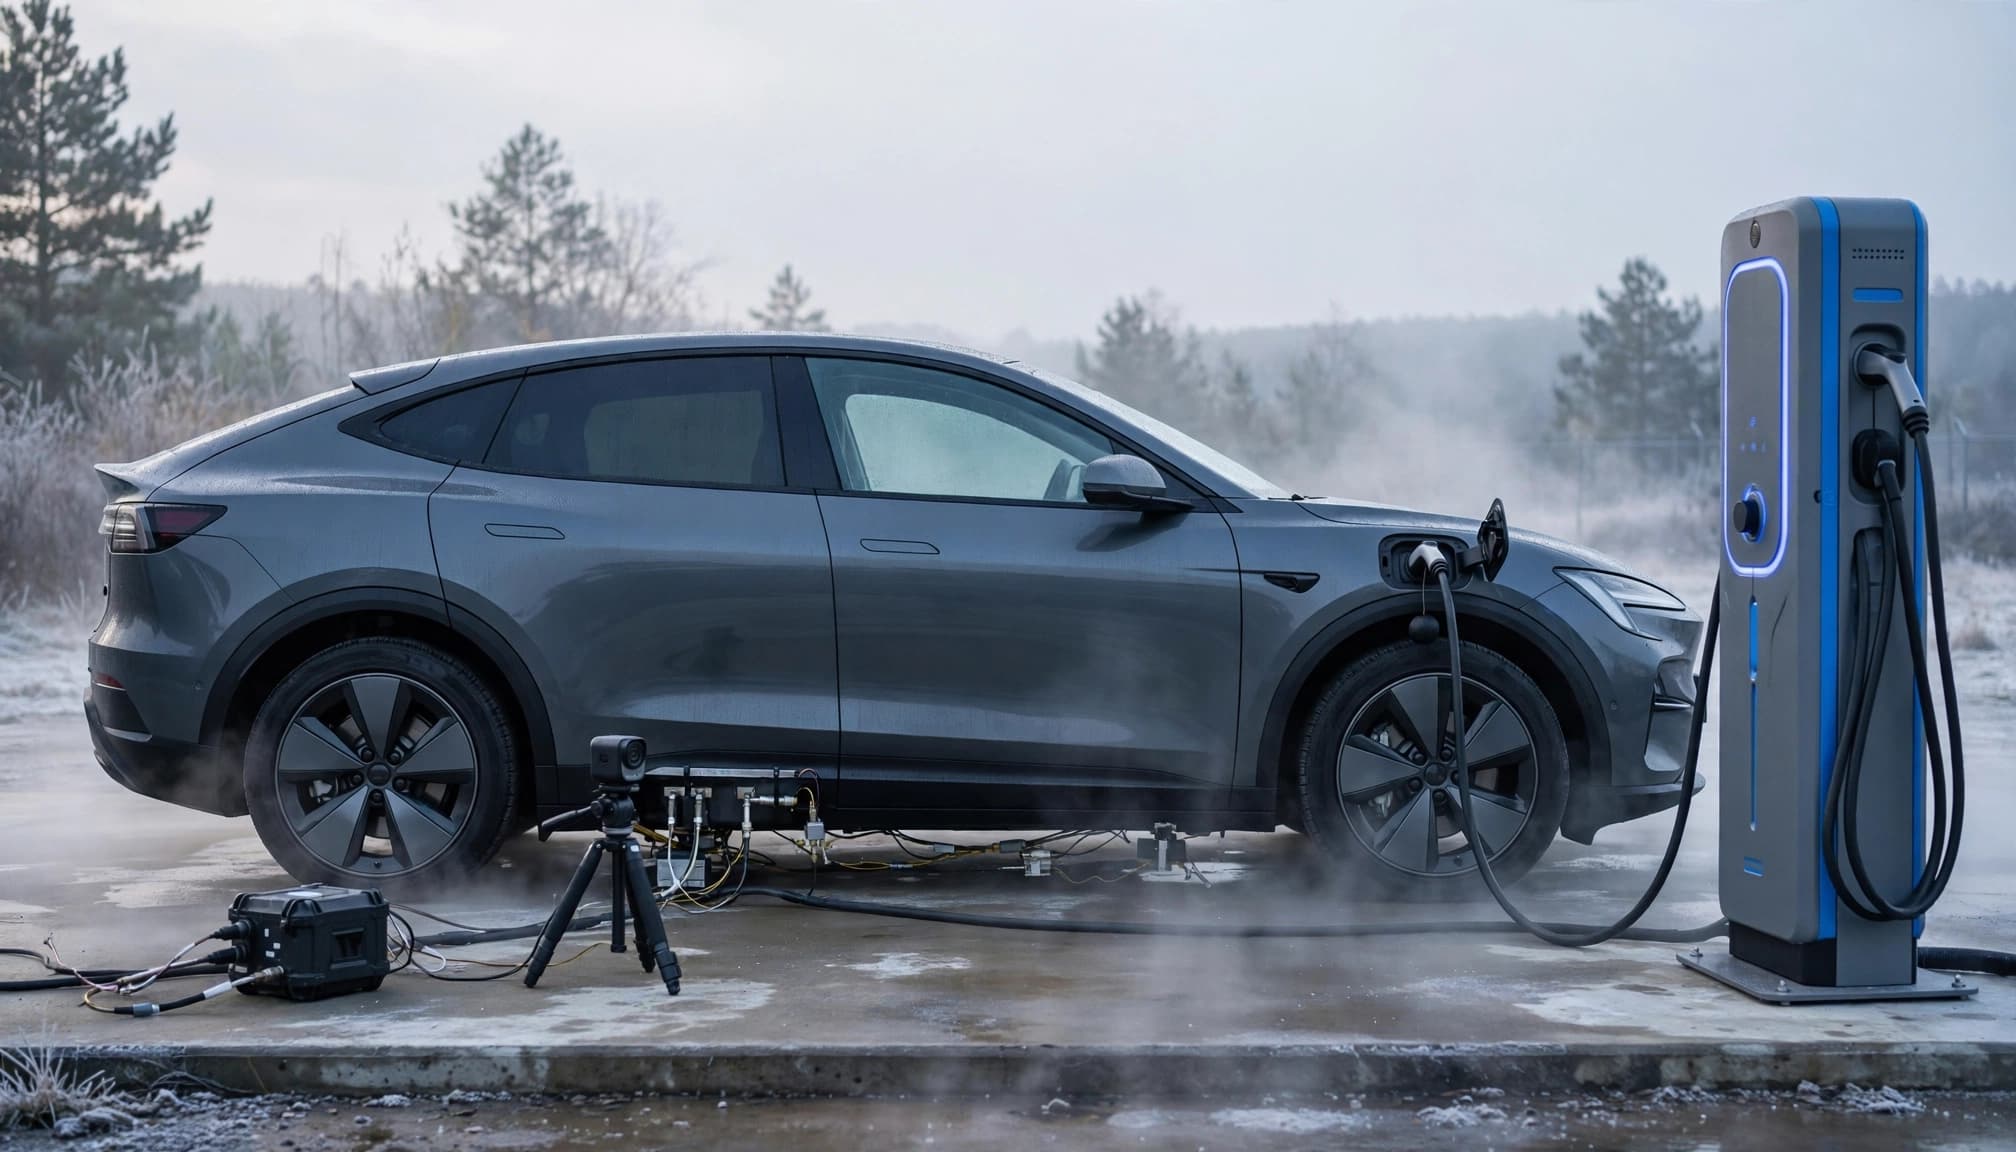
NREL's high-power charging test conditions include starting battery temperatures of 23°C, 40°C, and -7°C. Those are test conditions, not recommended charging targets.
The different starting temperatures help researchers separate vehicle capability from thermal effects.
A Hot Battery Can Need Less Power Too
Fast charging generates heat within the pack. The thermal management system has to remove enough of it to keep cell temperatures within the vehicle's limits.
Hot weather, demanding driving, repeated charging, and cooling-system capability can affect that balance. If cooling can't keep pace, the vehicle can reduce current.
Fans and pumps may become quite audible during a session. That activity can be normal. Cooling equipment is doing a job, and subtle isn't always part of the assignment.
NREL's battery thermal management research describes why temperature control matters for battery performance and life.
A rising temperature limit can create a slowdown before the usual high-SOC taper. SOC alone won't explain every drop.
What Preconditioning Can and Can't Do
Battery preconditioning adjusts pack temperature before fast charging. In cold conditions, it can move some of the warm-up work into the drive instead of leaving it for the beginning of the charging stop.
Give the Vehicle the Right Destination
Many EVs start battery preparation when a compatible DC fast charger is selected in the built-in navigation system. Some also offer a manual preparation control.
Selecting the actual charging station matters. Navigating to a nearby shop may not trigger the same process. A phone app showing directions doesn't necessarily send the vehicle the charging information it needs.
Cabin heating and battery preparation are separate functions, even when a vehicle coordinates them. Warm seats are lovely. They don't prove the pack is ready for high charging current.
Our guide to battery preconditioning before fast charging explains the thermal work behind that preparation.
Starting early gives the vehicle more time to reach suitable conditions. There isn't one preparation duration that fits every starting temperature and battery.
Preparation Helps Reach the Curve Sooner
Preconditioning usually helps the battery reach performance it already supports. It doesn't raise the vehicle's charging hardware limits or remove high-SOC taper.
A vehicle limited to 50 kW won't become a 250 kW vehicle because its pack is warm. And a suitably warm battery near full charge can still accept relatively little power.
Preparation also uses energy. During driving, that energy comes from the battery, so route planning needs to account for it.
The trade-off can still favor a shorter charging stop. At mild temperatures, the benefit may be small because the pack already needs little adjustment.
Use the supported controls. Hard acceleration or other improvised heating tricks add risk without giving you proper control of battery temperature.
When the Charger Is the Bottleneck
The vehicle's charging curve describes what it can accept under particular conditions. The station has to supply that power. Actual output is constrained by whichever limit becomes binding.
Voltage and Current Matter Together
Electrical power equals voltage multiplied by current. Divide watts by 1,000 to express the result in kilowatts.
At 400 volts, 500 amps corresponds to 200 kW. At 800 volts, the same current corresponds to 400 kW. These are electrical calculations, not charging promises for particular vehicles.
A station's headline rating may only be available within part of its voltage range. A current limit can prevent a lower-voltage pack from receiving the station's maximum advertised power.
Higher-voltage vehicle architectures can reduce the current required for a given power level. Their real charging performance still depends on compatible station output, battery limits, and thermal conditions.
A connector or adapter also doesn't automatically increase available power. Every component must operate within its supported limits.
Shared Capacity and Equipment Limits Can Flatten Output
Some sites share power between dispensers or allocate capacity across several charging sessions. Cable temperature and equipment cooling can also constrain output.
These patterns can help distinguish possible causes, though none proves a diagnosis by itself.
| Observed Pattern | Possible Explanation |
|---|---|
| Power falls progressively as SOC rises | Normal vehicle taper |
| Power begins low, then rises as the pack warms | Battery temperature limitation |
| Power holds below expected vehicle capability | Station power or current limit |
| Output changes when another session starts | Shared capacity or site controls |
| Power drops with an equipment warning | Charger or vehicle fault |
Look at the pattern and the messages together. A single low number doesn't identify who is limiting the session.
Moving to another stall may help when equipment is the constraint. It won't restore peak charging power to a battery already in its normal taper.
For charging operators, this distinction matters too. A functioning high-power dispenser can deliver modest power because the connected vehicle requests it. Charger utilization data needs that context before anyone declares the hardware inadequate.
How to Compare Charging Curves Fairly
A charging curve is a record of a session under particular conditions. It becomes useful comparison evidence when those conditions are documented.
Otherwise, two tidy lines can tell a rather untidy story.
Match the Vehicle and Starting Conditions
Compare the same model year, battery configuration, and relevant software where possible. Battery options within one vehicle name can have different charging behavior.
Then consider starting SOC, battery temperature, preconditioning, and station capability. A cold-soaked test and a prepared highway arrival answer different questions.
Both can be useful. One shows a difficult starting condition; the other shows performance after preparation. Treating them as equivalent hides the reason the curves differ.
Also distinguish a single session from repeatable behavior. One unusually fast or slow trace doesn't establish what an owner should expect every time.
A useful test explains what was measured, where it was measured, and when the timer started.
Compare the Window You Actually Need
A driver taking short motorway stops may care most about lower-to-middle SOC performance. Someone facing a long gap between chargers may care more about how charging holds up above 80%.
Compare elapsed time over those relevant windows. Also compare energy delivered and the vehicle's driving efficiency.
There's a graph-reading detail worth keeping straight: the area under a power-versus-time curve gives energy. The area under a power-versus-SOC curve doesn't directly give energy, because its horizontal axis isn't time.
So a visually large area on an SOC chart isn't a shortcut to calculating kilowatt-hours delivered.
A strong comparison brings the curve, session time, battery capacity, and efficiency together. Maximum kW remains useful, but it belongs in that group rather than sitting above everything else.
Turning the Curve Into a Better Road Trip
The practical goal is to spend less total time traveling while keeping enough energy for the route. That gives charging decisions a clearer purpose than chasing a particular percentage.
Choose Departure Charge for the Next Leg
Start with the next reachable compatible charging opportunity and an arrival reserve suited to the conditions. Wind, speed, temperature, elevation, and accessories affect energy use.
If you have enough energy for that leg, waiting through a slow upper portion may add little value. If the next reliable option is distant, staying longer can be the sensible choice.
NREL's station impact analysis describes how charging to 100% can substantially extend a session for a relatively small range gain.
That finding supports avoiding unnecessary waiting. It doesn't erase the value of extra range when your route needs it.
Our guide to planning EV fast-charging stops connects charging targets with compatibility, routing, and reachable alternatives.
Keep enough reserve to preserve options. Arriving nearly empty for the sake of a prettier peak number is a poor trade.
Count Detours and Stop Overhead
Several shorter sessions can reduce time spent in the slow part of the curve. They also create more opportunities for detours, queues, payment delays, and unavailable stalls.
A charging strategy that wins on battery mathematics can lose on the road. Every extra stop has overhead.
Meals, rest breaks, and destination charging change the calculation too. If the car charges while you're already stopped, some slower charging may cost no additional travel time.
Vehicle efficiency belongs here as well. Energy added per minute only becomes driving distance after you account for consumption.
For fleets, repeatable turnaround time can matter more than one exceptional peak. Predictable charging windows, suitable arrival SOC, and reliable equipment make scheduling easier.
The curve helps you choose. Your actual route decides whether that choice works.
Why Home Charging Looks Different
Most discussion of dramatic charging curves concerns DC fast charging. Home AC charging operates at much lower power, and another piece of vehicle hardware enters the picture.
The Onboard Charger Sets an AC Limit
With AC charging, the vehicle's onboard charger converts alternating current into direct current for the battery. Its rating limits power alongside the electrical supply and charging equipment.
During DC fast charging, the station performs the main AC-to-DC conversion outside the vehicle. The vehicle's battery controls still regulate what the pack accepts.
That's why an EV can advertise a high DC maximum while charging at a much lower rate at home. The two numbers describe different charging paths.
At ordinary AC power levels, charging may remain fairly steady through much of the session because power is already well below the pack's fast-charging capability.
Near-Full Charging Still Needs Time
AC charging can also slow near full. Battery balancing, temperature management, and the vehicle's upper charge controls still apply.
The effect on your day is different when the car is parked overnight. A slower final portion may happen while you're asleep rather than while you're watching a service-area clock.
Our home charging time calculator estimates AC charging time using battery capacity, starting charge, target charge, and charging limits.
It's designed for home-charging estimates. A DC session needs a changing-power model to describe its curve properly.
Also keep the daily home limit separate from a road-trip fast-charging target. They answer different questions about convenience, battery guidance, and time.
Does Charging Taper Protect Battery Health?
Tapering helps keep cell voltage, current, and temperature within the battery's operating limits. Those controls support battery durability as well as safe operation.
They don't make every battery age identically. Chemistry, thermal design, time, temperature exposure, and use all affect long-term behavior.
NREL's research on fast charging and battery life examines the additional heat generated during fast charging. That connection helps explain why cooling capability matters alongside charging power.
One slow session doesn't establish degradation. A cold pack, a high starting SOC, or a limited charger can produce a slow session in a healthy vehicle.
Likewise, reaching peak power once isn't a complete battery-health assessment. Charging performance and remaining energy capacity are related measurements, but they aren't interchangeable.
Battery chemistry also changes the operating strategy. Lithium iron phosphate, or LFP, and nickel-based batteries can have different manufacturer charging routines. A periodic full-charge instruction for one vehicle shouldn't become a blanket rule for every pack using that chemistry.
Our discussion of daily DC fast-charging trade-offs covers how charging habits fit alongside cost, convenience, and battery management.
The useful habit is to let the vehicle manage its limits and use its supported preparation features. Trying to defeat a limit removes protection without creating a better battery.
Persistent changes under comparable conditions deserve more attention than one disappointing number on a cold afternoon.
How to Diagnose an Unexpected Slowdown
Start with the conditions you can observe. You don't need to guess at battery failure because the charging display is having an underwhelming moment.
A gradual taper near full needs a different response than a sudden power collapse at low SOC.
- Note the starting percentage and how power changes. A high starting SOC can explain modest power immediately. An upward trend after a slow start can fit battery warm-up. A sharp drop deserves attention to any accompanying message.
- Read the vehicle and charger messages. A cold-battery notice, charging restriction, or equipment error is more informative than the maximum rating printed on the dispenser. Record the message rather than relying on memory.
- Consider station-side limits before changing stalls. Shared capacity, current limits, and equipment faults can constrain output. A different compatible dispenser can help with an equipment problem, but reconnecting won't remove the car's normal high-SOC taper.
- Keep a useful record if the problem repeats. Starting SOC, ambient conditions, preparation status, station identification, elapsed time, and delivered energy help distinguish a pattern from an isolated event.
A few well-timed observations are more useful than constantly refreshing the app. Note whether power rises, holds steady, falls gradually, or changes abruptly.
For a meaningful comparison, repeat conditions as closely as practical. Comparing a prepared battery at low SOC with a cold battery near full won't isolate a fault.
Also distinguish lower power from stopped charging. If the target charge has been reached, the vehicle may have ended the session as intended.
Repeated poor charging despite suitable preparation and capable equipment can justify professional diagnosis. Thermal-system faults, sensor problems, software issues, and battery restrictions need proper service data.
Don't open high-voltage components or attempt cooling-system repairs beside the charger. Warning messages involving battery safety, smoke, or overheating require the vehicle's emergency procedure and appropriate assistance.
Frequently Asked Questions
Why Is My EV Charging Slowly at a Powerful Charger?
The station rating describes its capability under suitable conditions. Your vehicle may request less power because of SOC, battery temperature, or its own charging limit.
Station current limits, shared power, and equipment problems can also reduce output. The displayed kW number alone doesn't identify the cause. Use the charging pattern and system messages together.
Does Every EV Slow Down at 80%?
Charging behavior varies, and many vehicles begin reducing power earlier. The slowdown often becomes more noticeable in the upper charge range.
Treat 80% as a useful planning reference. The actual curve and the energy needed for your next leg determine whether stopping there makes sense.
Can Preconditioning Prevent Charging Taper?
Preconditioning can reduce temperature-related restrictions, particularly with a cold battery. It doesn't remove the current reductions needed as cells approach their upper operating limits.
A prepared battery can therefore charge quickly early in a session and still slow substantially near full. Both behaviors can occur during a perfectly normal stop.
Should I Unplug as Soon as Power Starts Falling?
A falling number alone isn't a reason to leave. Charging power may decline while the session still adds useful energy at a reasonable pace.
Consider the time needed for your remaining energy requirement. Leave when you have enough for the next leg and your planned reserve, rather than reacting to each downward step.
Does a Slower Curve Mean the Battery Is Worn Out?
Slow charging can have temporary causes, including temperature, high starting SOC, and station limitations. It doesn't establish lost battery capacity.
A repeated change under comparable conditions is more informative. Professional diagnostics can separate charging restrictions, thermal faults, and battery condition when the pattern persists.
Can a Software Update Change the Charging Curve?
Yes. Charging controls are software-managed, so an update can change permitted power, thermal preparation, or how limits are applied.
That possibility is another reason to include software information when comparing tests. Hardware limits still apply, and an update doesn't guarantee a higher peak or a shorter session.
Plan Around the Curve, Not the Peak
A charging curve makes the changing numbers understandable. Battery percentage, temperature, vehicle controls, and station capability all shape how quickly energy arrives.
The strongest road-trip measure is time to the energy you need. Peak power helps describe capability, but sustained performance determines how useful that capability becomes.
Arrive with a sensible reserve, use supported battery preparation, and choose departure charge for the next leg. Then let the curve explain the slowdown without letting one falling number run the whole trip.
Sources & further reading

Written by
LarryLeoLarryLeo started EV Charging while researching his own next car purchase. He digs into the pros, cons and real cost savings of going electric — using government, standards-body and manufacturer sources — and shares what he finds so other buyers can decide with confidence.
Why trust EV Charging Guide
Our guides are researched from government, standards-body and manufacturer sources, reviewed for accuracy, and updated when rules or products change. Brands cannot pay for placement. Read our editorial policy.